Tutorial
This tutorial aims to introduce the basics of iracema’s architecture and usage.
Usage
This section presents a quickstart guide to iracema.
Import conventions
Throughout this documentation, all the code examples will assume that iracema has been imported using the following convention.
>>> import iracema as ir
Loading audio files
To load an audio file, you must provide a string that specifies the location
where it is stored. Iracema accepts local paths to load files stored in your
computer or http URLs to download remote files. The class ir.Audio
provides the method load for this purpose.
import iracema as ir
audio = ir.Audio.load("05 - Trumpet - Haydn.wav")
To play the loaded audio:
audio.play()
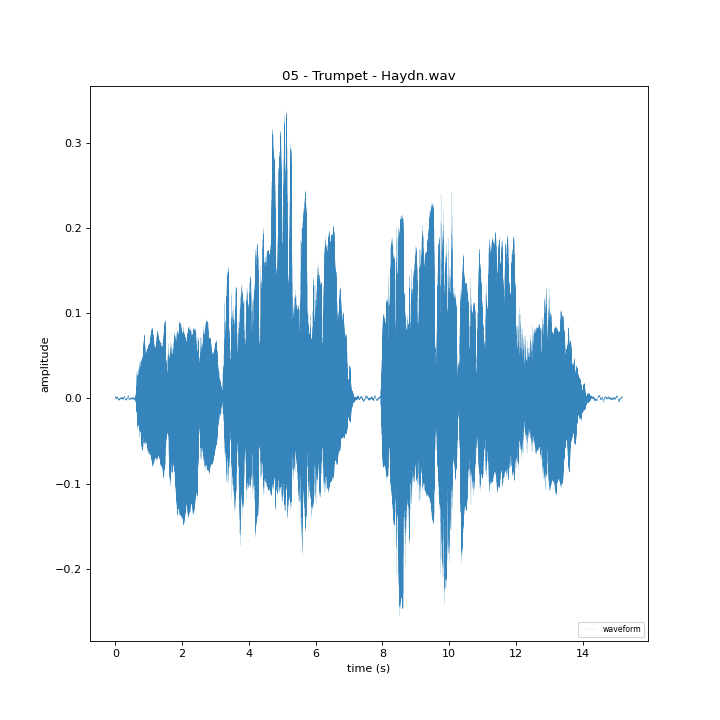
The audio object has a plot method available that displays its waveform:
audio.plot()
Calculating basic features
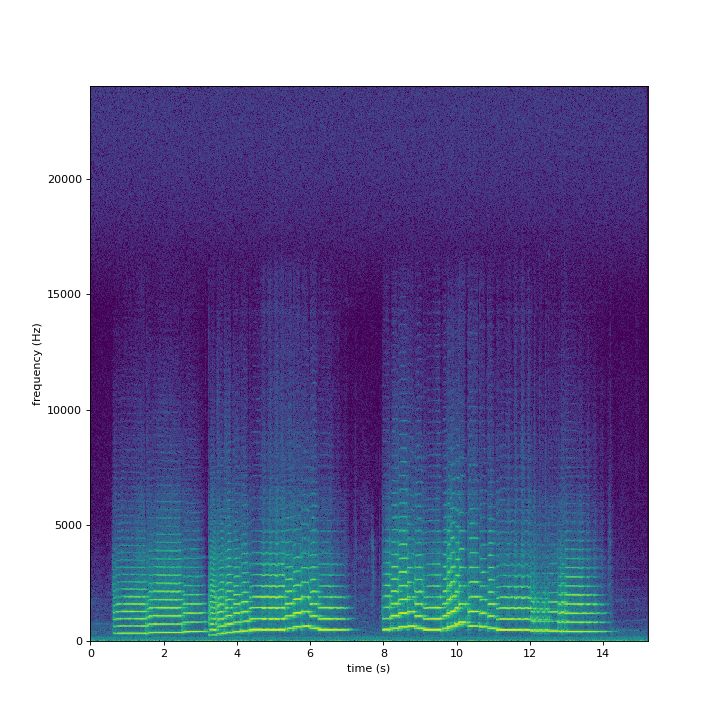
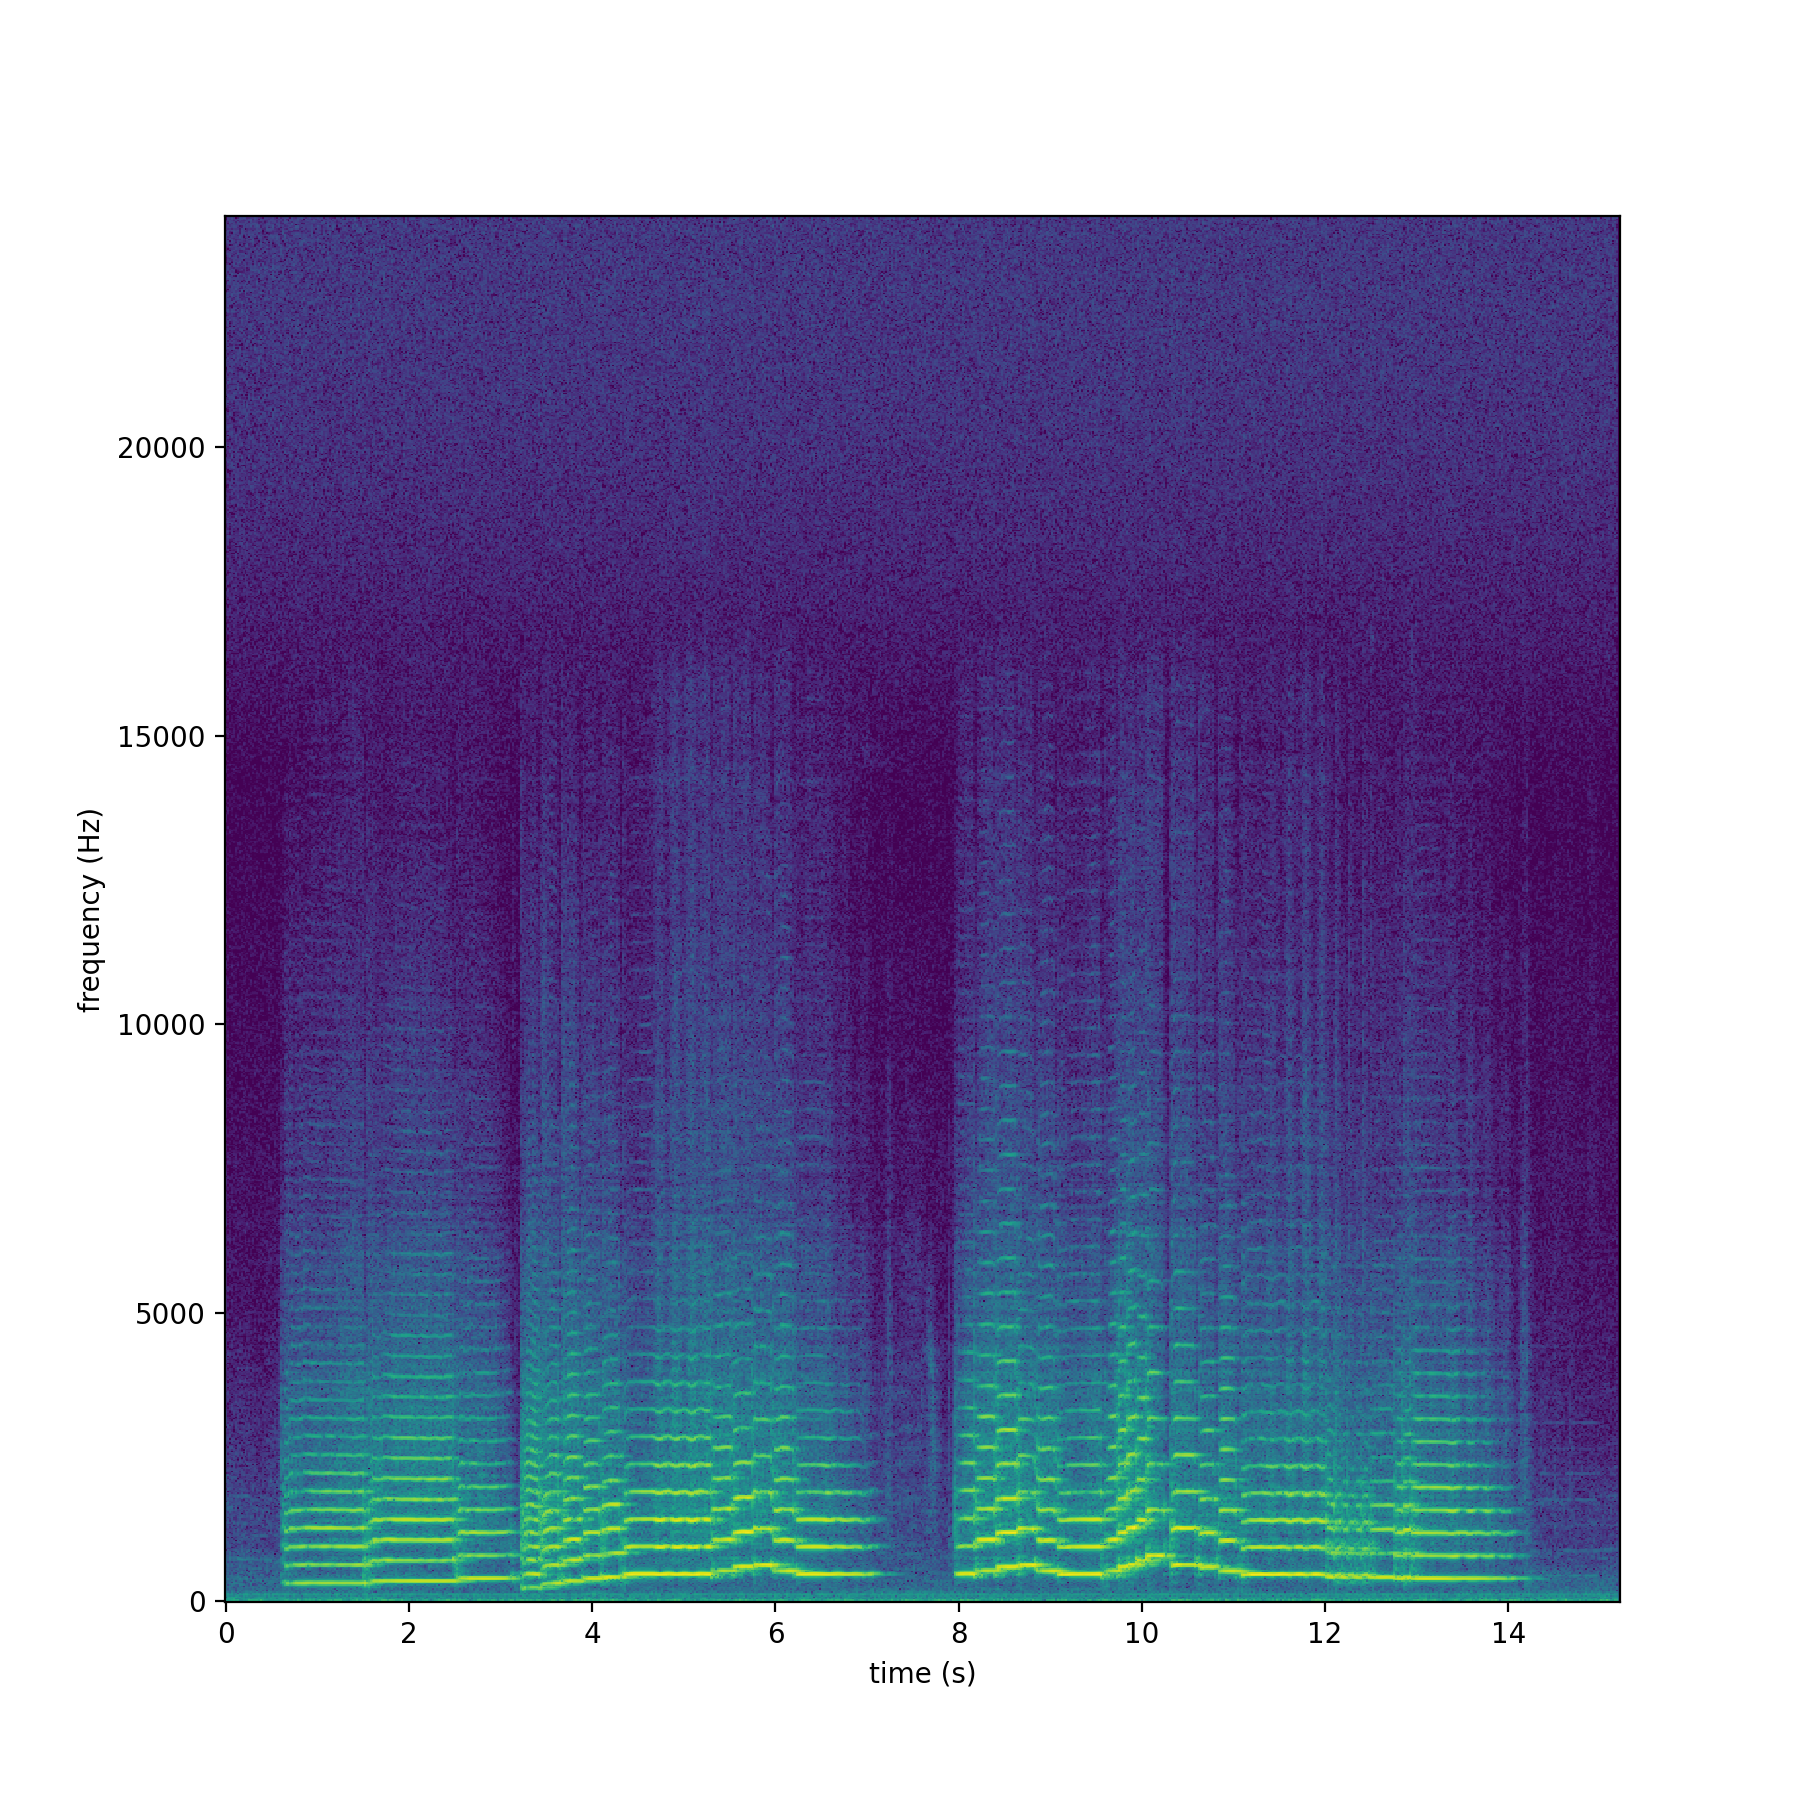
As most features will need an object containing an STFT as input, our next step is to calculate it for the loaded
audio using ir.spectral.STFT. You must specify the sliding window and
hop size values (in samples). After calculating the STFT, the spectrogram can
be plotted using ir.plot.spectrogram.
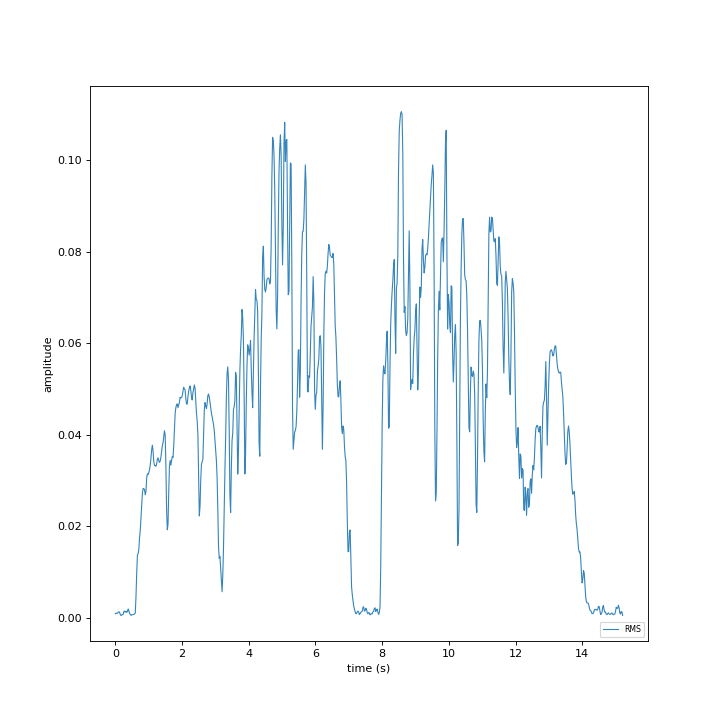
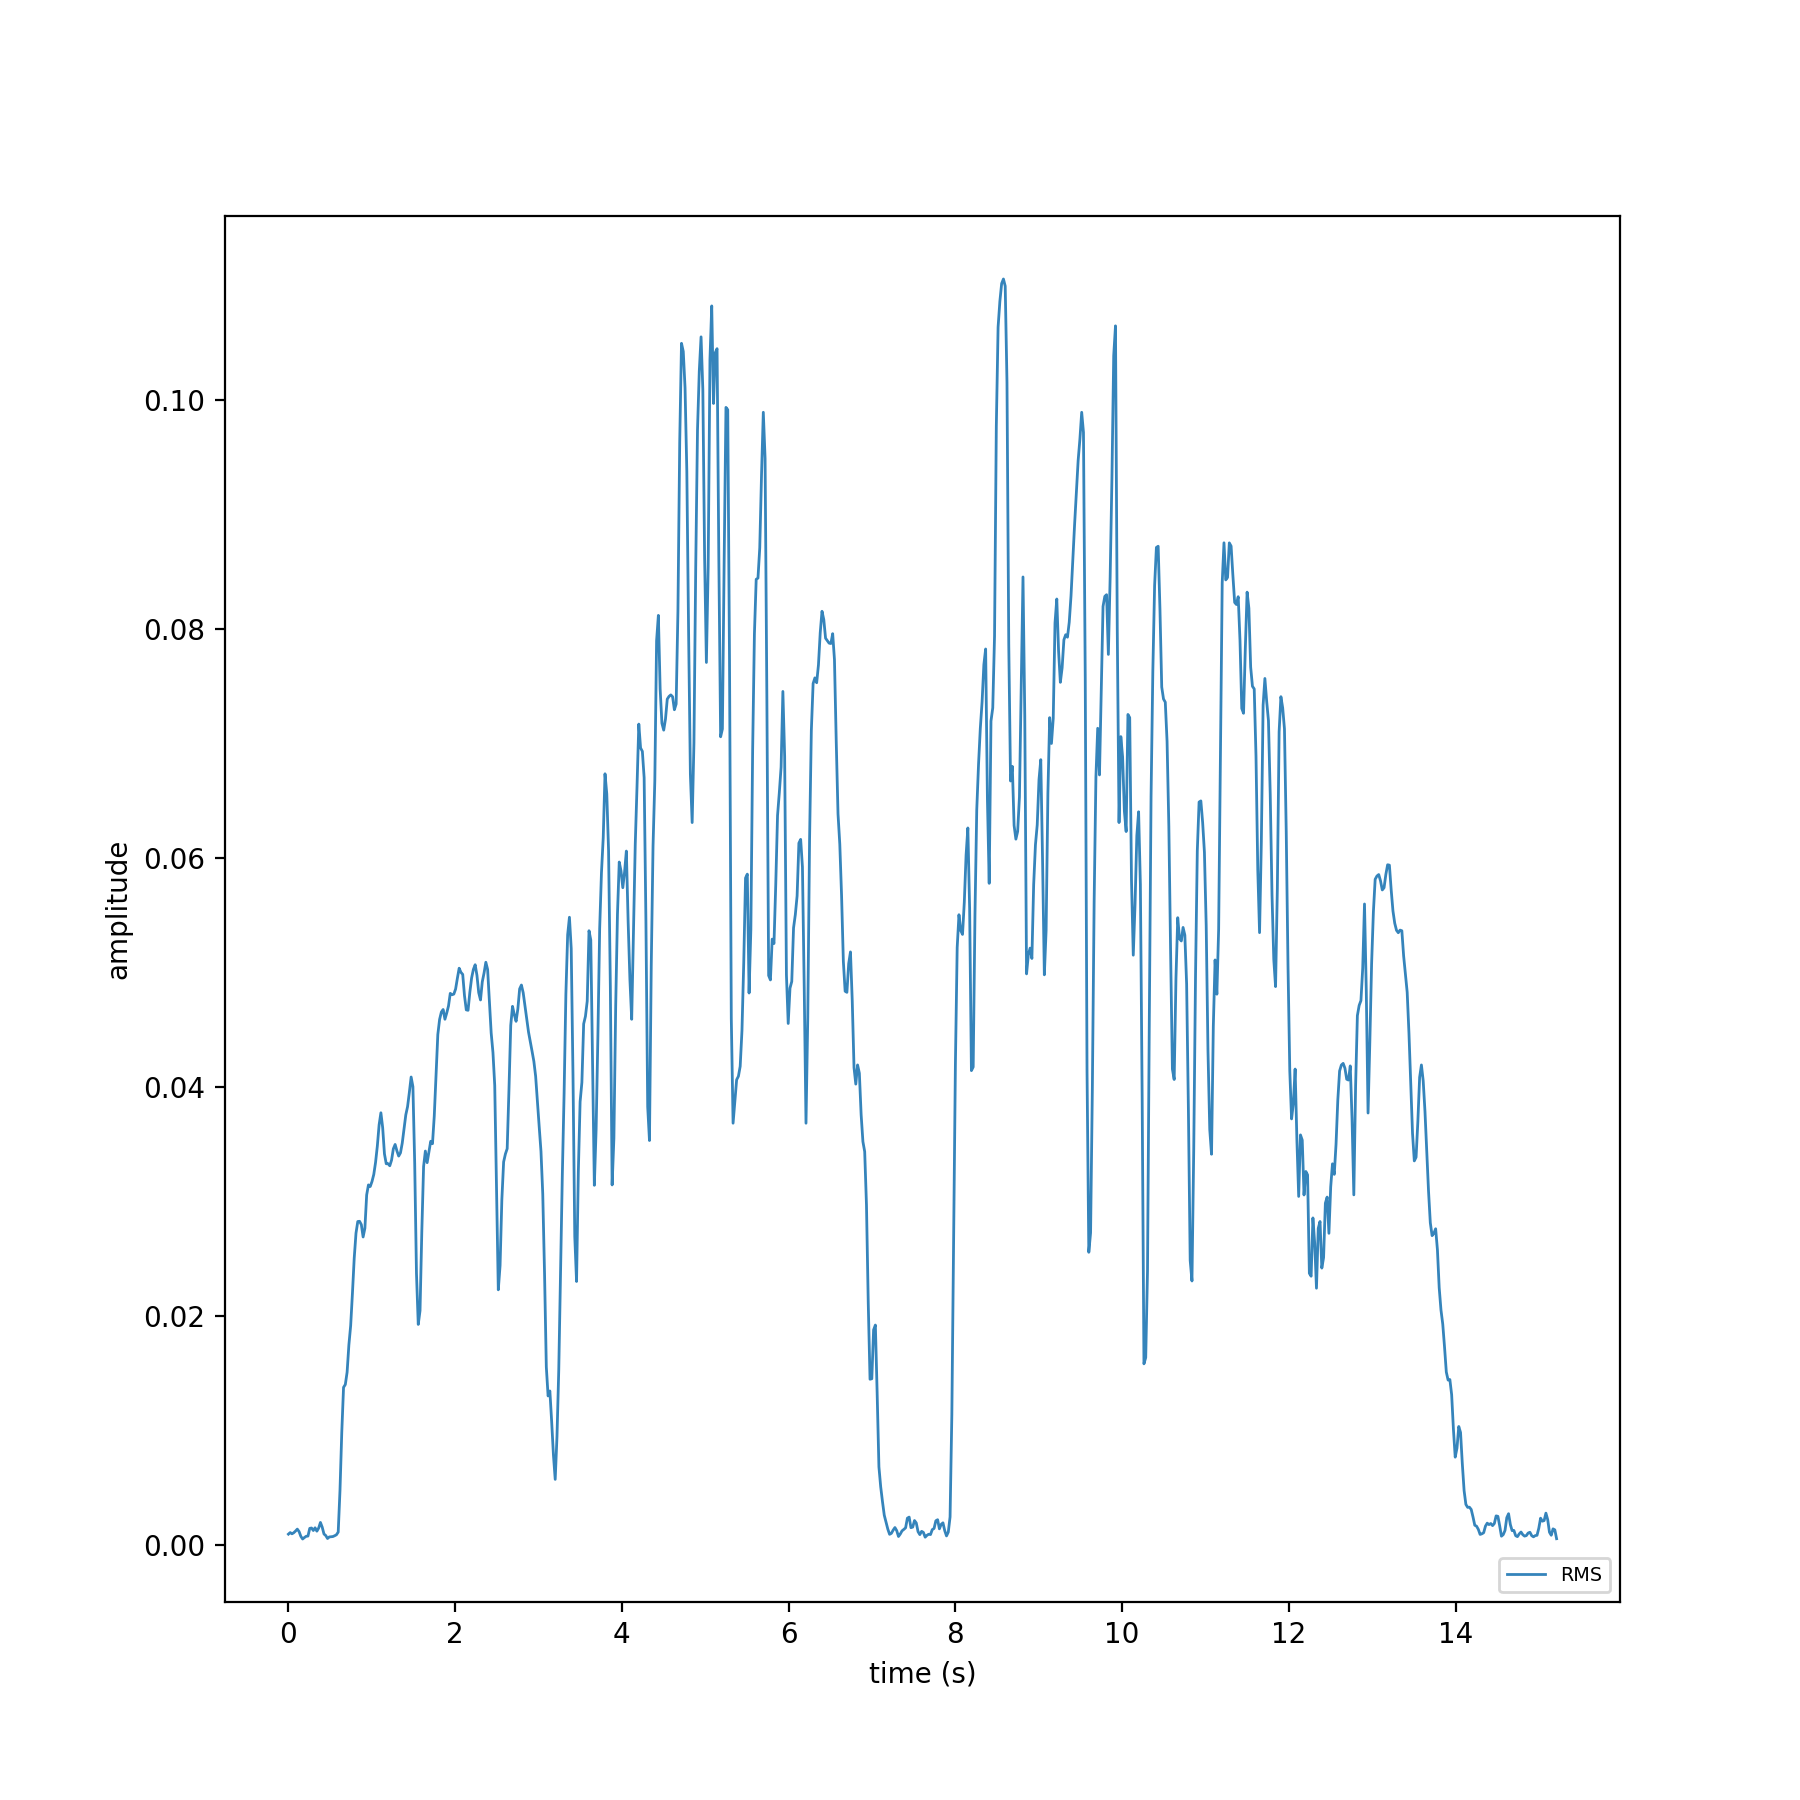
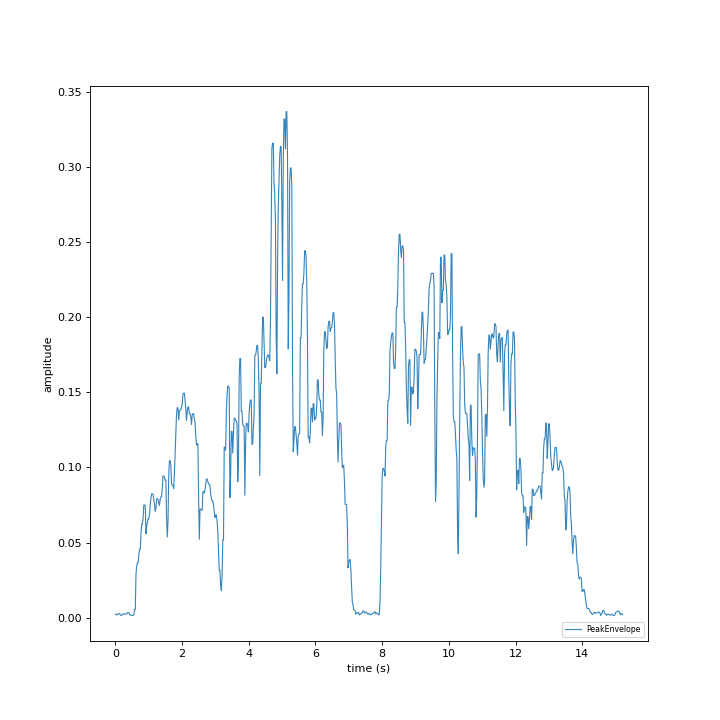
Other useful methods are RMS and Peak Envelope, which will be extracted and plotted in the example.
# specifying window and hop sizes
window, hop = 2048, 1024

# calculating the STFT
stft = ir.spectral.STFT(audio, window, hop)

# plotting the spectrogram
ir.plot.spectrogram(stft)

# calculating the RMS
rms = ir.features.rms(audio, window, hop)

# plotting the RMS
rms.plot()

# calculating the Peak Envelope
peak = ir.features.peak_envelope(audio, window, hop)

# plotting the Peak Envelope
peak.plot()


Extracting pitch and harmonics
Another important step is to extract pitch. One possible way of doing it is using the Harmonic Product Spectrum method. But you can check other methods in the pitch module. Now you can extract the harmonics, as it’s dependent on a pitch method. Iracema already has a bulit-in function for plotting the harmonics over the spectrogram. Notice that the harmonics methods return a dictionary, with it’s keys corresponding to three TimeSeries objetcs: ‘frequency’, ‘magnitude’ and ‘phase’.
# extract pitch
hps_pitch = ir.pitch.hps(stft, minf0=1, maxf0=1000)

#extract harmonics
harmonics = ir.harmonics.extract(stft, hps_pitch)